
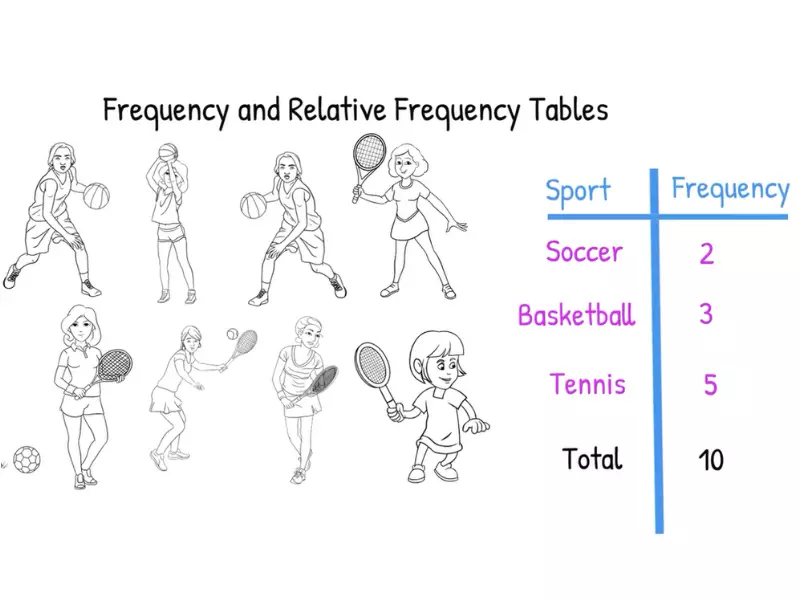
In the realm of statistics, frequency and relative frequency stand as fundamental concepts, pivotal for analyzing and interpreting data. These terms are often mentioned in academic textbooks, research papers, and data analysis reports, reflecting their importance in understanding how often specific values appear within a dataset. While they may seem straightforward at first glance, a deeper comprehension reveals their critical role in statistical analysis and decision-making processes.
The difference between frequency and relative frequency lies in their representation of data. Frequency refers to the count of times a particular value appears in a dataset. In contrast, relative frequency is the ratio of the number of times a specific value occurs to the total number of observations in the dataset. This distinction is crucial for interpreting data accurately, as it provides insights into the proportion of occurrences of each value within a given context.
These concepts not only serve as the backbone for descriptive statistics but also play a significant role in probability theory and inferential statistics. By offering a clear way to quantify and compare the occurrence of different values, frequency and relative frequency enable researchers and analysts to draw meaningful conclusions about their data. Understanding these terms is essential for anyone looking to delve into data analysis, research, or statistical study.
Frequency Explained
Definition of Frequency
In statistics, frequency refers to the number of times a particular data point appears in a dataset. It is a basic yet crucial concept that helps in understanding the distribution and pattern of data in various fields such as science, business, and economics.
Types of Frequency
Frequency can be classified into different types, each serving a specific analytical purpose. The most common types are cumulative frequency and joint frequency.
Cumulative Frequency
Cumulative frequency is the total number of times that a value and all values that precede it appear in a dataset. It provides a running total that helps in understanding the distribution of data points over a range.
- Step 1: List data in ascending order.
- Step 2: Tally the frequency of each data point.
- Step 3: Add each frequency to the sum of the frequencies before it.
Joint Frequency
Joint frequency refers to the number of times two or more specific data points occur together in a dataset. It is often used in the analysis of variables that may influence each other.
- Step 1: Identify pairs or groups of data points.
- Step 2: Count occurrences of these pairs/groups.
Examples in Real-World Data
Frequency analysis is applied in various real-world scenarios. For instance, businesses might analyze the frequency of product sales to determine popular items, or researchers may look at the frequency of certain behaviors in a study group.
Relative Frequency Unpacked
Definition of Relative Frequency
Relative frequency is the fraction or percentage of the time a value appears in a dataset relative to the total number of observations. It provides insight into the proportion of each category or value within the overall data.
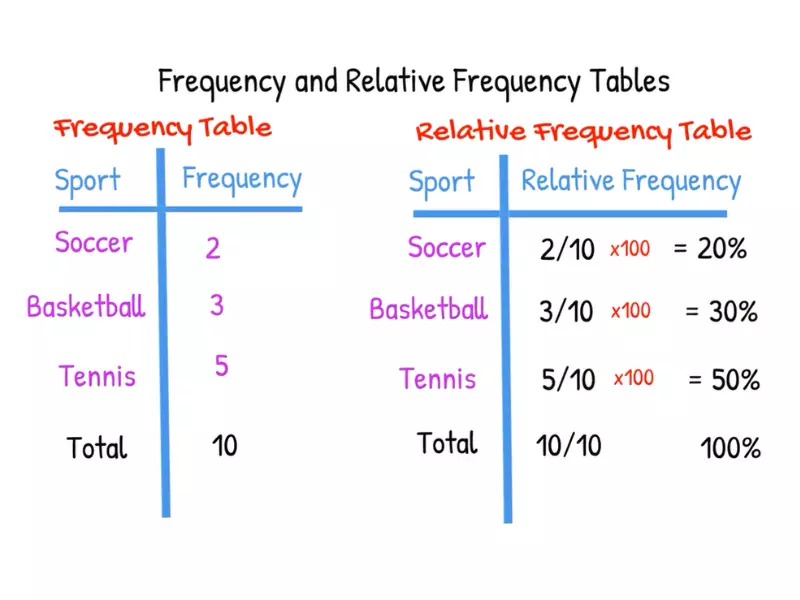
Calculation Method
To calculate relative frequency:
- Step 1: Calculate the frequency of the data point.
- Step 2: Divide by the total number of data points in the dataset.
- Step 3: (Optional) Multiply by 100 to get a percentage.
Importance in Statistical Analysis
Relative frequency is crucial for understanding the probability of events in a dataset, enabling comparisons between categories or values that have different total observations.
Comparing Frequency and Relative Frequency
Key Differences
While both frequency and relative frequency measure how often data points occur, they serve different analytical purposes. Frequency gives the raw count, while relative frequency offers a proportionate perspective.
Table Comparison
| Aspect | Frequency | Relative Frequency |
|---|---|---|
| Definition | Number of occurrences | Proportion of total |
| Representation | Count | Percentage or fraction |
| Analytical Purpose | Identifying patterns | Understanding proportions |
Application Contexts
Frequency is useful for identifying common or rare events, while relative frequency helps in comparing different datasets or categories within a dataset.
Calculation Examples
Frequency Calculation in Dataset
Imagine a dataset listing student grades:
- A: 5
- B: 15
- C: 10
- D: 2
The frequency of grade ‘A’ is 5.
Relative Frequency Calculation in the Same Dataset
To calculate the relative frequency of grade ‘A’:
- Total observations = 32
- Relative frequency of ‘A’ = 532325
Expressed as a percentage, this is approximately 15.625%.
Application in Data Analysis
Role in Descriptive Statistics
Frequency and relative frequency are foundational to descriptive statistics, offering a straightforward way to summarize and describe data sets. They allow statisticians to:
- Identify patterns: By observing how often each data point appears, analysts can pinpoint trends and common occurrences within the data.
- Summarize data: These measures help in creating a concise summary of large data sets, making them more understandable and easier to communicate.
Use in Probability
Relative frequency, in particular, plays a crucial role in estimating probabilities. It is based on the idea that the likelihood of an event can be approximated by how frequently it has occurred in past data. This approach is especially useful in:
- Predicting future events: By analyzing past occurrences, statisticians can forecast future probabilities.
- Comparative studies: It allows researchers to compare the occurrence rates of events across different datasets or conditions.
Impact on Data Interpretation
Both frequency and relative frequency significantly impact how data is interpreted. They provide a quantitative basis for making informed decisions, understanding phenomena, and testing hypotheses. By converting raw data into more digestible forms, these statistical tools enhance our ability to derive meaningful insights.
Visual Representation
Graphs and Charts for Frequency
Visual tools such as histograms, bar charts, and frequency polygons are commonly used to graphically represent frequency data. These visualizations help in:
- Highlighting distribution: Visual tools make it easier to see how data points are distributed across different categories or intervals.
- Identifying outliers: They can help pinpoint data points that deviate significantly from the rest of the dataset.
Visualizing Relative Frequency Data
Relative frequency data is often represented through pie charts and stacked bar charts. These visualizations allow viewers to:
- Understand proportions: They provide a clear picture of how each category or data point relates to the whole dataset.
- Compare categories: Visual tools enable easy comparison of different categories within the same dataset.
Advantages and Limitations
Benefits of Using Frequency
- Simplicity: Frequency is straightforward to calculate and understand, making it accessible to individuals with various levels of statistical knowledge.
- Versatility: It can be used across a wide range of data types and in various fields of study.
Benefits of Using Relative Frequency
- Comparability: It allows for the comparison of datasets of different sizes by converting frequencies into proportions or percentages.
- Insight into probabilities: Provides an empirical basis for estimating the likelihood of future events based on historical data.
Limitations and Considerations
While frequency and relative frequency offer valuable insights, they have limitations:
- Context dependency: Their significance can vary depending on the context and nature of the data.
- Misinterpretation risks: Without proper context, these statistics can lead to misleading conclusions.
Common Misunderstandings
Clarifying Confusions Between Frequency and Relative Frequency
One common confusion is equating frequency with probability. Frequency is a count of occurrences, while relative frequency can be used to estimate probabilities. Understanding this distinction is crucial for accurate data interpretation and analysis.
Tips for Effective Use
Best Practices in Calculating and Interpreting
- Consistency in data collection: Ensure data is collected using consistent methods to maintain accuracy.
- Understand the context: Always interpret frequency and relative frequency within the context of the dataset and research goals.
- Use appropriate visualizations: Choose the right type of graph or chart based on the data and what you aim to convey.
Software Tools and Resources
Several software tools can facilitate the calculation and visualization of frequency and relative frequency, including:
- Excel and Google Sheets: Offer basic functions and chart types for simple frequency analysis.
- Statistical software: Packages like SPSS, R, and Python libraries (Pandas, Matplotlib) provide advanced capabilities for more complex analyses.
FAQs
What is frequency in statistics?
In statistics, frequency refers to the number of times a specific data point or value appears within a dataset. It provides a simple way to understand how often various values occur, which is crucial for summarizing and analyzing data effectively.
How do you calculate relative frequency?
Relative frequency is calculated by dividing the frequency of a specific value by the total number of data points in the dataset. This calculation yields a proportion or percentage that represents how much of the dataset is made up by that specific value.
Why is understanding frequency and relative frequency important?
Understanding frequency and relative frequency is vital for accurately interpreting and analyzing data. These metrics offer insights into the distribution and proportionality of data points within a dataset, facilitating more informed decision-making and research conclusions.
Can frequency and relative frequency be visualized?
Yes, both frequency and relative frequency can be visualized using various types of charts and graphs, such as histograms, bar charts, and pie charts. These visual representations help in easily identifying patterns, trends, and outliers in the data.
Conclusion
Frequency and relative frequency are more than mere statistical jargon; they are essential tools for data analysis, providing clear insights into the structure and dynamics of datasets. Understanding the distinction between these concepts enables analysts, researchers, and statisticians to interpret their data more accurately, ensuring that decisions and conclusions are based on solid empirical evidence.
The ability to calculate and apply frequency and relative frequency in practical scenarios marks a fundamental skill in statistical analysis. As we continue to generate and sift through ever-growing amounts of data, the significance of these concepts only escalates, highlighting the importance of a robust statistical foundation for anyone engaged in data-driven fields.