
Covariance and variance stand as pillars within the realm of statistics, offering insights into the volatility of individual data sets and the relationship between pairs of datasets, respectively. These concepts not only provide foundational understanding for statistical analysis but also enable researchers and analysts to interpret and predict data behavior more accurately. Variance sheds light on the dispersion of a dataset, indicating how far individual numbers are from the mean, whereas covariance extends this idea to two datasets, showing how one variable moves in relation to another.
At the core, the relationship between covariance and variance is intertwined, with variance being a special case of covariance when the two datasets under comparison are identical. This fundamental connection allows for the exploration of data in a multidimensional space, enabling the understanding of how variables interact with each other. Covariance measures the degree to which two variables vary together, while variance measures how much a single variable varies on its own.
Understanding this relationship enriches our approach to data analysis, providing a nuanced view of how variables not only behave in isolation but also how they influence each other. Variance tells us about the spread of our data, offering insights into its stability and predictability. Covariance, on the other hand, helps us understand the direction of the relationship between two variables, indicating whether they tend to move in tandem or in opposite directions. This knowledge is crucial in fields ranging from finance, where it informs investment decisions, to machine learning, where it helps in feature selection and model improvement.
Basics of Variance
Definition
Variance is a statistical measure that quantifies the spread or dispersion of a set of data points around their mean value. It signifies how much the numbers in the dataset deviate from the average (mean) value. In simpler terms, variance tells us how spread out the data is.
Calculating Variance
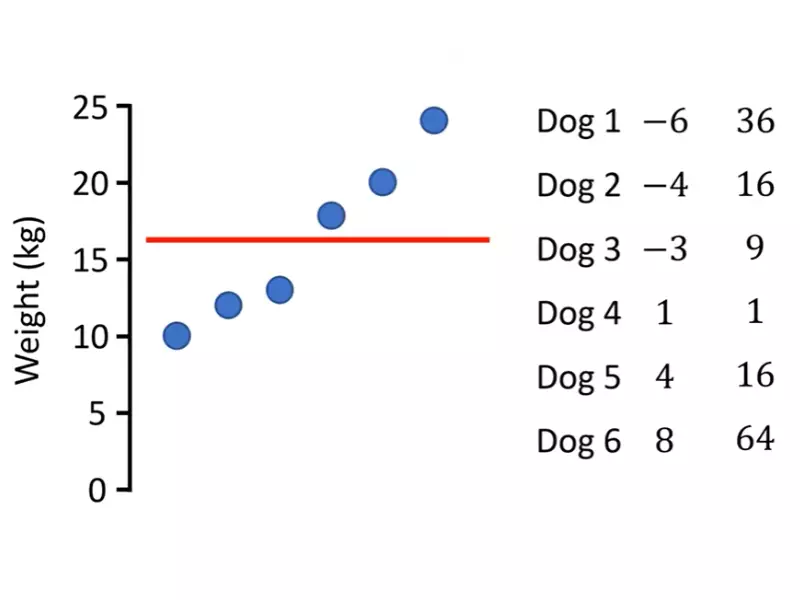
To calculate the variance of a dataset, follow these steps:
- Find the mean (average) of the dataset.
- Subtract the mean from each data point to find the deviation from the mean for each data point.
- Square each deviation.
- Find the average of these squared deviations. This is the variance.
Here’s the formula for variance (�2σ2) for a population:
�2=∑�=1�(��−�)2�σ2=N∑i=1N(xi−μ)2
Where:
- �2σ2 is the variance,
- ��xi represents each data point,
- �μ is the mean of the dataset,
- �N is the number of data points in the population.
For a sample, the formula adjusts slightly to:
�2=∑�=1�(��−�ˉ)2�−1s2=n−1∑i=1n(xi−xˉ)2
Where �2s2 is the sample variance, �ˉxˉ is the sample mean, and �n is the sample size.
Role in Statistics
Variance is foundational in statistics because it provides a numerical value that represents the variability of a dataset. High variance indicates a wide spread of data points, while low variance suggests that the data points are closely clustered around the mean. Understanding variance is crucial for assessing the reliability and predictability of data, making informed decisions, and performing further statistical analyses such as standard deviation and z-scores.
Basics of Covariance
Definition
Covariance is a measure that determines how two variables change together. It indicates whether increases in one variable correspond with increases in another variable (positive covariance), or if increases in one variable correspond with decreases in the other variable (negative covariance). Essentially, covariance measures the directional relationship between the pairs of variables.
Calculating Covariance
To calculate covariance, follow these steps:
- Determine the mean of each variable.
- Subtract the respective means from each value of the two variables to find the deviations.
- Multiply the deviations of each pair of values from the two variables.
- Calculate the average of these products. This is the covariance.
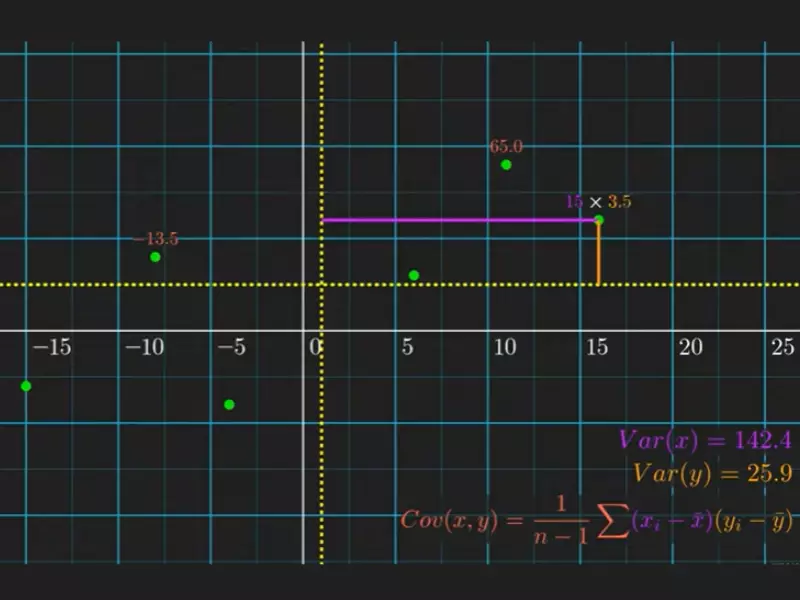
The formula for covariance (���(�,�)cov(X,Y)) is:
���(�,�)=∑�=1�(��−�ˉ)(��−�ˉ)�−1cov(X,Y)=n−1∑i=1n(xi−xˉ)(yi−yˉ)
Where:
- ��xi and ��yi are the values of the two variables,
- �ˉxˉ and �ˉyˉ are the means of those variables, respectively,
- �n is the number of data pairs.
Significance
Covariance is significant because it helps to identify the direction of the relationship between two variables. However, it does not quantify the strength of the relationship nor its dependency ratio. It is a preliminary step towards more advanced analyses like correlation, which normalizes the covariance value, providing a clearer understanding of the strength and direction of the relationship.
Variance and Covariance
Linking Concepts
Variance and covariance are linked by their core concepts of spread and directional relationship. Variance can be considered a special case of covariance where the relationship of a dataset is examined with itself. This relationship highlights the foundational role of these measures in understanding the dynamics of data.
Comparative Analysis
While variance focuses on the spread of a single variable, covariance extends this analysis to the relationship between two variables. Variance is always non-negative, reflecting the squared distances of data points from the mean, whereas covariance can be negative or positive, reflecting the nature of the relationship between variables.
Variance in Depth
Components
The key components of variance include the mean of the dataset, deviations from the mean, and the squared deviations. These components work together to quantify the spread of the dataset.
Interpretation
The interpretation of variance hinges on its magnitude. A high variance indicates a wide spread of data points, suggesting greater variability. Conversely, a low variance indicates that the data points are closely gathered around the mean, suggesting less variability and more consistency.
Examples
- In finance, variance is used to measure the volatility of stock returns.
- In quality control, variance helps in assessing the consistency of product measurements.
Covariance in Depth
Components
Covariance involves the means of two variables, the deviations of data points from those means for each variable, and the product of these deviations. It combines these components to assess how two variables move in relation to each other.
Interpretation
The sign of covariance is crucial for interpretation:
- Positive covariance indicates that the variables tend to move in the same direction.
- Negative covariance suggests that the variables move in opposite directions.
- A covariance close to zero implies little to no linear relationship.
Examples
- In portfolio theory, positive covariance between stock returns suggests that the stocks tend to move together, whereas negative covariance indicates that the stocks move inversely, which might be desirable for diversification.
- In marketing, understanding the covariance between advertisement spending and sales can help in assessing the effectiveness of marketing campaigns.
Relationship Analysis
Mathematical Connection
The mathematical link between covariance and variance is integral to understanding their relationship. Variance is essentially the covariance of a variable with itself. This connection is vital as it underscores the unified framework within which both measures operate, providing insights into the variability of single variables (variance) and the relationship between pairs (covariance).
Graphical Representation
Graphical tools such as scatter plots vividly illustrate the relationship between two variables, highlighting the concept of covariance. When data points are plotted, the slope of the line of best fit through these points can indicate the direction and, to some extent, the strength of their relationship. A positive slope suggests a positive covariance, while a negative slope indicates a negative covariance. Variance doesn’t have a graphical representation in the same sense, as it’s a measure of spread within a single dimension.
Real-life Applications
Understanding the relationship between covariance and variance has practical applications in numerous fields:
- Finance: Investors use these measures to diversify portfolios, managing risks by combining assets with varying covariances.
- Quality Control: Manufacturers analyze the variance and covariance of product characteristics to maintain quality standards.
- Sports Analytics: Teams study the performance variance of players and their covariance in team dynamics to strategize effectively.
Variance-Covariance Matrix
Introduction
The variance-covariance matrix is a square matrix that encapsulates the variances of individual variables along its diagonal and the covariances between pairs of variables in the off-diagonal elements. This matrix is fundamental in multivariate statistical analyses, offering a comprehensive view of the relationships within a dataset.
Utility in Multivariate Analysis
In multivariate analysis, the variance-covariance matrix plays a critical role by:
- Risk Assessment: Quantifying the volatility and correlations of multiple assets.
- Pattern Recognition: Identifying relationships among variables in large datasets.
- Optimization: Assisting in portfolio optimization and other decision-making processes where multiple outcomes are considered simultaneously.
Example
Consider a dataset with two variables, A and B. The variance-covariance matrix might look like this:
| A | B | |
|---|---|---|
| A | Var(A) | Cov(A,B) |
| B | Cov(B,A) | Var(B) |
This matrix helps to visualize not just how each variable varies but also how they co-vary with each other.
Calculating Relationship
Steps for Calculation
Calculating the relationship between variables involves:
- Identifying Variables: Choose the variables for analysis.
- Data Collection: Gather accurate and relevant data.
- Computing Means: Calculate the mean of each variable.
- Determining Deviations: Find the deviations of each value from its variable’s mean.
- Multiplying and Averaging: For covariance, multiply the deviations of pairs and average them. For variance, square these deviations before averaging.
Tools and Software
Several tools and software facilitate these calculations:
- Excel: Offers functions like VAR.S for sample variance and COVAR for covariance.
- R: A statistical programming language with functions like
var()andcov()for these calculations. - Python: Libraries like NumPy and pandas include
np.var(),np.cov(), and similar functions for dealing with datasets.
Applications in Finance
Portfolio Theory
In portfolio theory, variance and covariance are crucial for diversification. By combining assets with low or negative covariance, investors can reduce the overall risk of the portfolio. The variance of portfolio returns gives an idea of the risk involved.
Risk Management
Variance and covariance are used in risk management to understand the volatility of assets and their relationships. This understanding helps in making informed decisions to mitigate risks. For example, Value at Risk (VaR) calculations often rely on these statistical measures to predict potential losses.
Applications in Data Science
Machine Learning Models
In machine learning, variance and covariance are used to understand the behavior of features within datasets. High variance in a model’s prediction indicates overfitting, while covariance between features can signal redundant information, affecting model performance.
Feature Analysis
Analyzing the variance and covariance among features helps in feature selection, enabling the construction of more efficient models. Features with low variance may not contribute much to the model’s predictive power, while features with high covariance might carry similar information, suggesting that one can be removed to simplify the model.
Frequently Asked Questions
What is Variance?
Variance quantifies the dispersion of a dataset by calculating the average squared deviation from the mean. This measure is crucial for understanding the data’s spread, indicating the degree of variability within the dataset. High variance points to wider spread, while low variance indicates that the data points are closer to the mean.
How is Covariance Calculated?
Covariance is calculated by assessing how two variables move together. It involves taking the products of the deviations of each pair of observations from their respective means and averaging those products. A positive covariance indicates that the variables tend to move in the same direction, while a negative covariance suggests they move inversely.
Why is the Relationship Between Covariance and Variance Important?
The relationship between covariance and variance is fundamental in statistics as it provides insights into how different variables interact with each other. Understanding this relationship helps in analyzing the correlation between variables, which is essential for predictive modeling, risk management, and decision-making in various fields such as finance, economics, and data science.
How Does Variance Affect Data Interpretation?
Variance affects data interpretation by offering a measure of the data’s reliability and stability. Low variance suggests that the data points are consistently close to the mean, indicating predictability. In contrast, high variance shows greater dispersion, suggesting that the data may be less reliable for making predictions due to its wider spread.
Conclusion
The exploration of covariance and variance illuminates the intricate dance between individual data points and their collective movements. By dissecting the relationship between these two statistical measures, we gain a deeper understanding of data’s nature, its inherent connections, and the patterns it weaves across different contexts. Variance offers a window into the stability of a single dataset, while covariance extends this perspective to the dynamic interplay between pairs of datasets, enriching our analytical toolkit.
This dual perspective not only advances our statistical acumen but also enhances our ability to make informed decisions based on data analysis. Whether we are predicting market trends, assessing risk, or building predictive models, the nuanced insights derived from understanding the relationship between covariance and variance are invaluable. They empower us to navigate the complexities of data with greater confidence and precision, unlocking new possibilities for innovation and discovery in the vast domain of data-driven decision-making.