
Frequency and relative frequency are foundational concepts in statistics that serve as pillars for data analysis, interpretation, and presentation. They play critical roles in transforming raw data into meaningful information by quantifying occurrences and proportions. Frequency refers to the number of times a particular data point appears in a dataset, providing a simple count of occurrences without context to the dataset’s size or composition.
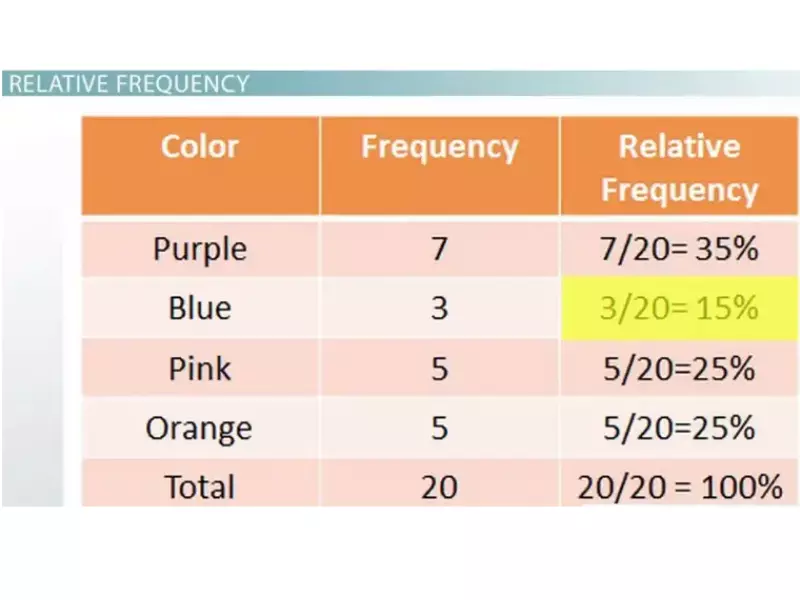
Relative frequency, on the other hand, is the proportion of times a particular data point appears relative to the total number of observations. It is calculated by dividing the frequency of a specific event by the total number of events, often expressed as a percentage or fraction. This measure offers a more comprehensive view of the data by considering the size of the dataset, allowing for a comparative analysis across different datasets or categories within a dataset.
Understanding the difference between frequency and relative frequency is essential for anyone working with data. Frequency gives a raw count that highlights the most common occurrences, whereas relative frequency provides insight into the likelihood or proportionality of these occurrences within the context of the entire dataset. This distinction is crucial for accurate data interpretation, effective research, and informed decision-making across various fields such as market research, psychology, and epidemiology.
Basics of Frequency
Definition and Examples
Frequency in statistics represents the number of times a particular value appears in a dataset. For example, if you have a list of grades from a class test and five students scored an A, the frequency of A grades is 5. This simple yet powerful concept forms the backbone of data analysis, providing a straightforward way to understand and interpret data collections.
Types of Frequency
Understanding different types of frequency deepens our grasp of data distribution and analysis techniques.
Cumulative Frequency
Cumulative frequency is the total number of times that a value and all values that precede it appear in a dataset. It provides a running total that shows the accumulation of data up to a certain point. Here’s how to calculate it:
- Start with the first value in your dataset.
- Add the frequency of the next value to the current total.
- Repeat this process for all values in your dataset.
Cumulative frequency helps in identifying median and percentile values in a dataset, offering insights into data trends over a series.
Marginal Frequency
Marginal frequency refers to the sum of frequencies for each variable in a table that represents two or more variables. It’s often used in the context of cross-tabulation or contingency tables where the focus is on understanding the relationship between two categorical variables.
Exploring Relative Frequency
Definition and Calculation
Relative frequency measures the proportion of times a particular value appears in a dataset relative to the total number of observations. It’s calculated by dividing the frequency of a specific event by the total number of events. For example, if there are 100 students in a class and 20 of them received an A grade, the relative frequency of receiving an A is 20/100 or 0.2.
Comparison with Frequency
While frequency counts the occurrences, relative frequency provides context by showing the proportion of these occurrences within the whole dataset. This distinction is crucial when comparing datasets of different sizes or when looking to understand the importance of specific occurrences within a larger context.
Significance in Data Analysis
Relative frequency offers a comparative perspective, essential for data analysis, especially when dealing with diverse datasets. It allows analysts to make meaningful comparisons across datasets, irrespective of their size, facilitating better decision-making and insights.
Key Differences
Calculation Method
The calculation of frequency is straightforward – a simple count of occurrences. Relative frequency, however, involves an additional step of dividing this count by the total number of observations, resulting in a proportion or percentage.
Representation
Frequency is often represented as a number or bar in a histogram, while relative frequency might be shown as a percentage, fraction, or pie chart, providing a visual representation of the data’s proportionality.
Application Areas
Frequency is primarily used for initial data exploration and identification of trends. Relative frequency, with its comparative nature, is crucial for probability calculations, statistical modeling, and cross-dataset analyses.
Frequency in Practice
Data Collection Techniques
Gathering accurate data is paramount. Effective techniques include surveys, observations, and automated data collection tools. Ensuring data integrity through random sampling and representative samples is crucial for meaningful frequency analysis.
Calculating Frequency
To calculate frequency, follow these steps:
- Identify the unique values or categories in your dataset.
- Count the number of occurrences for each value or category.
- Record these counts to analyze the distribution of data.
Practical Applications
Frequency analysis is widely used across fields such as market research, where companies identify the most common customer preferences, and education, to analyze grades distribution. It also plays a crucial role in quality control processes, enabling the identification of common defects or issues in products.
Relative Frequency in Depth
Computing Relative Frequency
To compute relative frequency, you divide the frequency of a specific event by the total number of events. This process transforms raw data into meaningful percentages, fractions, or ratios that reflect the proportionality of each event within the entire dataset.
Steps to Calculate:
- List all unique events or categories.
- Count the occurrences of each event (frequency).
- Divide each event’s frequency by the total number of events.
- Convert the result into a percentage or fraction for clarity.
This calculation gives insight into the significance of each event, showing not just how often it occurs, but its importance relative to the whole.
Visual Representation: Pie Charts and Histograms
Relative frequency data is often represented visually to aid in comprehension and analysis. Pie charts and histograms are two effective tools for this purpose.
Pie Charts
Pie charts provide a clear visual representation of relative frequency as slices of a pie, with each slice’s size proportional to the category’s representation in the dataset. They are particularly useful for displaying categorical data.
Histograms
Histograms, on the other hand, use bars to show the distribution of data. While similar to bar charts, histograms represent the frequency of data within intervals, making them ideal for continuous data. They can also be adapted to show relative frequency by adjusting the scale to reflect percentages instead of raw counts.
Role in Probability
Relative frequency plays a crucial role in the calculation of probabilities. In many practical scenarios, the probability of an event is estimated by observing its relative frequency within a known dataset. This approach, known as empirical probability, bases the likelihood of future occurrences on past data.
- Probability = Relative frequency of the event
- Empirical Probability = (Number of times an event occurs) / (Total number of trials)
This method provides a straightforward way to predict outcomes in real-world situations, from gambling odds to weather forecasting.
Comparative Analysis
When comparing datasets or making decisions based on data, understanding when to use frequency versus relative frequency is key.
When to Use Frequency
Use frequency when:
- Detailing simple counts or occurrences.
- The size of the dataset is uniform or comparison is not required.
- You’re interested in absolute numbers, such as total sales or occurrences.
When to Use Relative Frequency
Relative frequency is more appropriate when:
- Comparing different datasets or categories within a dataset.
- The dataset sizes vary, and a proportional understanding is necessary.
- Assessing the likelihood or significance of events relative to the whole.
Benefits and Limitations
Benefits
- Relative frequency offers a normalized view, making comparisons fair and meaningful across datasets of different sizes.
- It highlights trends and patterns that raw frequencies might not reveal.
Limitations
- Relative frequency can oversimplify data, potentially masking significant nuances in large datasets.
- It may be misleading if the dataset is too small or not representative of the larger population.
Applications in Real Life
Market Research
In market research, relative frequency helps businesses understand customer preferences and behavior patterns. For instance, analyzing survey data about product preferences can reveal the most popular choices, guiding product development and marketing strategies.
Quality Control
Manufacturers use relative frequency to identify common defects in production lines. By focusing on the proportion of defective items, they can pinpoint issues and make informed decisions about process improvements.
Social Science Research
Researchers in social sciences use relative frequency to analyze behavioral patterns and social trends. Whether studying voting behaviors or social media usage, relative frequency provides insights into how prevalent certain attitudes or behaviors are within a population.
Frequently Asked Questions
What is frequency in statistics?
In statistics, frequency refers to the number of times a specific value or category appears in a dataset. It is a simple count that helps identify the most or least common occurrences within the data, offering a basic level of insight into the distribution of values.
How is relative frequency calculated?
Relative frequency is calculated by dividing the frequency of a particular event by the total number of events in the dataset. The result can be expressed as a fraction, a decimal, or a percentage, providing a measure of how often an event occurs relative to the overall dataset.
Why is relative frequency important?
Relative frequency is important because it provides context to the raw counts of frequency. It allows researchers and analysts to understand the proportion of occurrences of a particular event within the context of the total dataset, facilitating comparison across different groups or categories and enhancing the interpretability of data.
Can frequency and relative frequency be the same?
In certain cases, frequency and relative frequency might appear to be the same, especially in datasets where the total count is very small, and an event occurs only once. However, conceptually, they are different measures; frequency is a count, while relative frequency is a proportion of that count relative to the whole.
Conclusion
Frequency and relative frequency are both pivotal in understanding and analyzing data, yet they serve different purposes. Frequency offers a straightforward count of how many times an event occurs, laying the groundwork for initial data exploration. Relative frequency, by providing a contextual proportion, deepens this understanding by highlighting how significant an event is relative to the total dataset. This dual perspective enriches data analysis, enabling more nuanced interpretations and informed decisions.
The choice between using frequency or relative frequency depends on the goal of the analysis. For a basic understanding of data distribution, frequency suffices. However, for comparative analyses or when the size of the dataset matters, relative frequency becomes indispensable. Together, they form a comprehensive toolkit for statisticians, researchers, and analysts across various disciplines, proving that both measures are crucial in the realm of data interpretation.