
When evaluating the impact of interventions or the association between exposures and outcomes in health research, two statistical measures often come to the forefront: the odds ratio (OR) and the relative risk (RR). Both play pivotal roles in the interpretation of clinical trials, observational studies, and risk assessments, yet they serve different purposes and provide unique insights. Understanding these measures is crucial for researchers, healthcare professionals, and anyone interested in the outcomes of medical research.
The odds ratio compares the odds of an event occurring in one group to the odds of it occurring in another group, while the relative risk compares the probability of an event happening in the exposed group versus the unexposed group. Though both are measures of association and often used interchangeably, they are not the same. The OR is particularly useful in case-control studies, whereas RR is more common in cohort studies and randomized controlled trials.
These metrics are foundational in epidemiology and medical research, guiding decisions in public health policies, clinical practice, and individual patient care. Their accurate interpretation helps in understanding the effectiveness of treatments, the likelihood of adverse health events, and the impact of potential risk factors on specific outcomes. As such, grasping the difference between odds ratio and relative risk not only aids in the critical evaluation of medical literature but also in the application of evidence-based medicine.

Basic Concepts
Odds Ratio Explained
Basic Definition
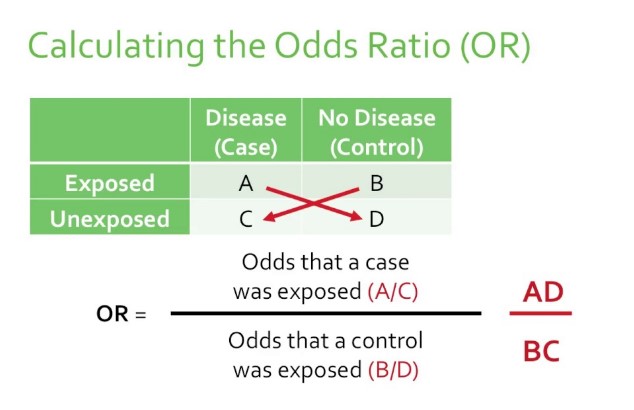
The Odds Ratio (OR) is a statistical measure used to describe the relationship between two events or conditions. It compares the odds of an event occurring in one group to the odds of it occurring in another group. In simple terms, OR helps to understand whether a particular exposure (like a new medication) increases or decreases the odds of a specific outcome (such as healing).
Calculation Method
To calculate the Odds Ratio, you can follow these steps:
- Identify the groups: Determine the group with the exposure and the group without.
- Count the outcomes: For each group, count the number of cases where the event occurred and did not occur.
- Calculate the odds: For each group, divide the number of event occurrences by the number of non-occurrences.
- Divide the odds: Divide the odds of the event occurring in the exposed group by the odds of the event occurring in the non-exposed group.
Example Scenario
Imagine a study to evaluate whether a new diet increases the odds of significant weight loss. Among 100 participants following the diet, 40 achieve significant weight loss. In the control group of 100 not following the diet, 20 achieve significant weight loss. The odds of significant weight loss in the diet group are 40/60, and in the control group, 20/80. The OR is (40/60)/(20/80) = 2.67, indicating the diet group had 2.67 times the odds of significant weight loss compared to the control group.
Relative Risk Explained
Basic Definition
The Relative Risk (RR), also known as the risk ratio, is another key measure in medical research. It compares the probability of an event happening in one group to the probability of it happening in another group. RR is particularly useful in assessing the effectiveness of a treatment or intervention by measuring the risk reduction or increase.
Calculation Method
To calculate Relative Risk, follow these easy steps:
- Identify the groups: One group receives the exposure or treatment, while the other does not.
- Calculate probabilities: For each group, calculate the probability of the event by dividing the number of event occurrences by the total number of individuals in the group.
- Divide the probabilities: Divide the probability of the event in the exposed group by the probability in the non-exposed group.
Example Scenario
Considering the same study on a new diet for weight loss, the probability of significant weight loss in the diet group is 40/100, and in the control group, it’s 20/100. The RR is (40/100)/(20/100) = 2. This means that the risk of significant weight loss in the diet group is twice as high as in the control group.
Key Differences
Calculation Basis
- OR: Comparison of Odds – The OR involves a comparison of the odds of an event occurring in one group versus another.
- RR: Comparison of Probabilities – The RR compares the probabilities of an event occurring, offering a direct measure of risk.
Interpretation
- Interpreting OR: An OR greater than 1 suggests a higher odds of the event in the exposed group, while less than 1 indicates lower odds. An OR of exactly 1 means no difference in odds between the groups.
- Interpreting RR: An RR greater than 1 indicates a higher risk in the exposed group, an RR less than 1 suggests a reduced risk, and an RR of 1 signifies no difference in risk.
Usage Context
- When to Use OR: The OR is particularly valuable in case-control studies where the outcome is rare or the study design is retrospective.
- When to Use RR: The RR is best applied in prospective cohort studies or randomized controlled trials where you can track the incidence of outcomes over time from the start.
Mathematical Relationship
While the OR and RR may seem similar, they serve different purposes and can lead to different conclusions, especially in studies with high event rates. The OR can exaggerate the perceived risk (or benefit) compared to the RR, particularly when the outcome of interest is common.
Limitations of Each in Certain Studies
- OR Limitations: Can overestimate risk in studies with a high incidence of the outcome.
- RR Limitations: Less useful in case-control studies due to the retrospective design and when outcomes are rare.
Advantages and Limitations
Odds Ratio
Advantages in Certain Studies
The Odds Ratio (OR) offers several advantages, especially in case-control studies where determining the direct risk is challenging due to the retrospective nature of the investigation. It’s ideal for studies focusing on rare diseases or outcomes because it can provide a meaningful measure of association even when the event of interest occurs infrequently. Additionally, the OR is useful for multiple logistic regression analyses, allowing for the adjustment of confounding variables and the examination of several risk factors simultaneously.
Limitations and Considerations
Despite its utility, the OR can be misleading in certain contexts. It tends to overestimate the risk especially when the outcome of interest is not rare within the study population. This can lead to exaggerated perceptions of association between exposure and outcome. Interpreting ORs as a measure of risk can be challenging for those not familiar with statistical nuances, potentially leading to confusion. Furthermore, the OR does not directly provide the probability of an event occurring, which is often more intuitively understood by clinicians and policymakers.
Relative Risk
Advantages in Clinical Settings
The Relative Risk (RR) is particularly valuable in prospective cohort studies and randomized controlled trials due to its straightforward interpretation. It directly measures how much an exposure increases or decreases the risk of a certain outcome, making it highly relevant for clinical decision-making and public health interventions. The RR is intuitively easier to understand than the OR, as it reflects the actual increase or decrease in risk, helping in the communication of research findings to a broader audience, including non-statisticians.
Limitations and Considerations
However, the RR has its limitations. It cannot always be calculated in case-control studies, where the incidence rate of outcomes is not known. This restricts its applicability in certain research designs. Additionally, the RR can be undetermined in situations where the probability of an outcome is zero in the control group, leading to challenges in its calculation and interpretation.
Application in Research
Choosing Between OR and RR
Factors Influencing the Choice
The selection between OR and RR largely depends on the study design and the frequency of the outcome. For instance:
- Case-Control Studies: Favor the use of OR due to the retrospective analysis and the focus on rare outcomes.
- Cohort Studies and Randomized Trials: Prefer RR, as these designs allow for the prospective tracking of incidence rates.
Impact on Study Outcomes
The choice between OR and RR can significantly affect how study outcomes are interpreted. The OR can exaggerate the effect size compared to the RR, potentially influencing clinical and policy decisions based on perceived risk or benefit.
Case Studies
Example of OR Application
In a study examining the association between smoking and lung cancer among 500 individuals, researchers found an OR of 4. This indicates that smokers had four times the odds of developing lung cancer compared to non-smokers, highlighting a strong association between smoking and lung cancer risk.
Example of RR Application
A clinical trial evaluating the effectiveness of a new vaccine against a contagious disease reported an RR of 0.5. This means that vaccinated individuals had a 50% lower risk of contracting the disease compared to those who were not vaccinated, demonstrating the vaccine’s efficacy.
Common Misinterpretations
Avoiding Confusion
Common Pitfalls in Interpreting OR and RR
A frequent mistake is interpreting the OR as a direct measure of risk, similar to the RR. This misunderstanding can lead to overestimating the strength of an association. Another pitfall is neglecting the impact of outcome frequency on the appropriateness of OR and RR, which can skew interpretation of the results.
Tips for Accurate Interpretation
- Always consider the study design and outcome frequency when choosing between OR and RR.
- Remember that the OR can overestimate risk in high-incidence settings.
- Ensure clear communication of findings, specifying whether OR or RR was used and its implications.
Statistical Significance vs. Practical Importance
Understanding the Difference
Statistical significance does not always equate to practical or clinical importance. A statistically significant finding may have a minimal effect size, meaning its real-world impact is limited. Conversely, findings with large effect sizes that are practically significant may not achieve statistical significance, especially in studies with small sample sizes.
Examples in OR and RR Context
- An OR of 1.05 might be statistically significant in a large study but indicates a very small increase in odds, questioning its clinical relevance.
- Conversely, an RR of 2.0, indicating a doubling of risk, represents a substantial increase in risk and is of high practical importance, even if statistical significance is marginal.
Frequently Asked Questions
What is Odds Ratio?
The odds ratio (OR) is a measure used in statistics to compare the odds of a certain event occurring in one group to the odds of it occurring in another group. It’s especially useful in case-control studies where the outcome of interest is rare, providing insight into the strength of the association between an exposure and an outcome.
What is Relative Risk?
Relative risk (RR) quantifies the risk of an event happening in one group compared to the risk in another group. It is commonly used in cohort studies and randomized controlled trials to evaluate the effect of a particular intervention or exposure on the likelihood of a specified outcome.
How do OR and RR differ in interpretation?
While both OR and RR offer measures of association between exposure and outcome, they differ in interpretation. The OR presents the odds that an event will occur, which can be less intuitive than the RR, which directly compares probabilities. This difference can lead to misunderstandings, especially in situations where the incidence of the outcome is high.
When to use Odds Ratio over Relative Risk?
Odds ratio is preferred in case-control studies where researchers look back in time to examine the exposure to a suspected risk factor. OR is also useful in situations where the outcome of interest is rare, as it remains a valid measure of association even in these circumstances.
Can Relative Risk be used in case-control studies?
Relative risk is typically not used in case-control studies due to the retrospective nature of these studies and the way participants are selected based on the outcome. Instead, the odds ratio is used as it can appropriately measure the association between exposure and outcome in these study designs.
Conclusion
Understanding the difference between odds ratio and relative risk is essential for accurately interpreting medical research and applying its findings to clinical practice, public health policy, and personal health decisions. Both measures provide valuable insights into the association between risk factors and outcomes, yet they do so in distinct ways that suit different types of study designs and research questions.
By appreciating the nuances of OR and RR, readers and researchers can better navigate the complex landscape of epidemiological studies, making informed decisions based on the evidence. Recognizing when each measure is appropriate and how to interpret its results is a critical skill in the application of evidence-based medicine, ultimately contributing to improved health outcomes and more effective interventions.