Frequency distribution is a cornerstone of statistical analysis, providing insights into how often certain values occur within a dataset. This foundational concept enables researchers, analysts, and data enthusiasts to grasp the essence of the data they are working with, highlighting patterns, trends, and anomalies. Relative frequency and cumulative frequency, while rooted in this basic principle, serve distinct purposes in the realm of data interpretation.
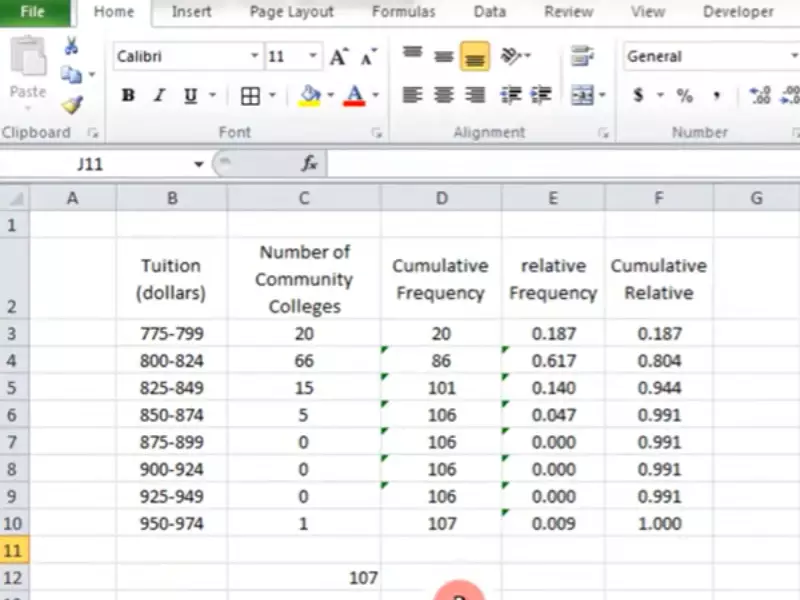
Relative frequency refers to the proportion of times a specific value occurs in relation to the total number of observations. Cumulative frequency, on the other hand, is the accumulation of the frequencies of all values up to a certain point in the dataset. These concepts are pivotal for understanding the distribution and aggregation of data in various contexts.
The distinction between relative frequency and cumulative frequency lies in their approach to data representation. Relative frequency offers a fractional perspective of data occurrences, providing clarity on the proportionate significance of each value within the whole. Cumulative frequency builds on this by aggregating frequencies in a sequential manner, thus depicting the progressive accumulation of data values. Both methodologies are invaluable for analyzing and interpreting datasets, each catering to different analytical needs and objectives.

Relative Frequency
Definition and Calculation
Relative frequency is a measure that shows the proportion or percentage of how often a particular value occurs in a dataset compared to the total number of values. To calculate the relative frequency of a specific value, follow these simple steps:
- Count how many times the value appears in the dataset.
- Divide this count by the total number of observations in the dataset.
- Express the result as a percentage or fraction.
This calculation gives insight into the importance or significance of a value within the context of the entire data collection.
Significance in Data Analysis
Relative frequency plays a crucial role in data analysis. It allows analysts to understand the distribution of data points within a dataset, making it easier to identify patterns, trends, and anomalies. By converting raw counts into relative terms, data becomes more digestible and comparable across different sets or categories.
Examples in Real Life
Consider a survey conducted on favorite ice cream flavors among 100 people. If 25 people choose vanilla, the relative frequency of vanilla as a favorite flavor is 25/100=0.2525/100=0.25 or 25%. This simple calculation allows us to compare the popularity of vanilla against other flavors directly, despite any differences in total survey participants.
Cumulative Frequency
Definition and Calculation
Cumulative frequency is the sum of the frequencies of all values up to a certain point in a dataset. It provides a running total that helps to understand the number of observations below a particular value. Here’s how to calculate it:
- List the values in ascending order.
- Add the frequency of the current value to the sum of the frequencies of all preceding values.
- Continue this process for all values in the dataset.
This method accumulates frequencies, offering a broader view of the data’s distribution.
Importance for Data Interpretation
Cumulative frequency is essential for data interpretation, especially in identifying medians, quartiles, and percentiles. It allows analysts to determine the distribution’s shape and to assess whether the data skews towards higher or lower values. Moreover, it facilitates the understanding of how many data points fall within specific ranges.
Examples in Various Fields
In education, cumulative frequency can help to understand how students score on a test. By aggregating scores, educators can identify how many students scored below a certain threshold, aiding in curriculum adjustments or targeted assistance.
Key Differences
Conceptual Distinctions
While relative frequency offers a perspective on the proportion of individual values within a dataset, cumulative frequency focuses on the aggregation of these values. The former is about parts of a whole, and the latter is about building upon each part to form a whole.
Calculation Methods
- Relative frequency is calculated by dividing the frequency of a value by the total number of data points.
- Cumulative frequency requires sequentially adding frequencies to provide a running total.
Use Cases
Relative frequency is best suited for analyzing the prevalence or importance of specific data points, while cumulative frequency is ideal for understanding distributions and identifying data ranges.
Practical Applications
Survey Analysis
In survey analysis, relative frequency can highlight the most common responses, allowing researchers to pinpoint trends in opinions or preferences. Cumulative frequency can show how responses accumulate, providing insights into the overall distribution of opinions.
Market Research
Market research benefits from both approaches. Relative frequency can identify the most popular products or features among consumers, whereas cumulative frequency helps to understand consumer income distribution or spending habits.
Educational Assessment
In educational assessment, relative frequency can show the prevalence of certain scores, indicating common problem areas or subjects. Cumulative frequency, however, can help to categorize students based on performance, facilitating targeted teaching strategies.

Comparative Analysis
Advantages of Relative Frequency
Relative frequency offers unique insights that are pivotal for data analysis and interpretation. Its main advantages include:
- Simplicity and Clarity: It simplifies complex datasets by converting raw data into understandable percentages or fractions, making comparisons across different categories or groups straightforward.
- Flexibility in Analysis: Enables analysts to examine the data from various perspectives, whether looking at a single category in isolation or comparing multiple categories side by side.
- Effective for Large and Small Datasets: Whether dealing with vast amounts of data or a small collection of information, relative frequency can provide valuable insights without being overwhelmed by sheer volume.
Advantages of Cumulative Frequency
Cumulative frequency, while building on basic frequency data, brings its own set of benefits to the table:
- Insight into Distribution: It provides a comprehensive view of how values accumulate, which is essential for identifying distribution patterns such as skewness.
- Basis for Statistical Measures: It is crucial for calculating quartiles, percentiles, and the median, offering a foundational tool for deeper statistical analysis.
- Enhanced Data Interpretation: Helps in understanding the proportion of data points that fall below or above certain values, aiding in decision-making processes.
Choosing the Right Frequency Type
Selecting between relative and cumulative frequency depends on the specific goals of the data analysis:
- Goal Orientation: If the aim is to understand the proportion of individual categories within the whole, relative frequency is more appropriate. For insights into data distribution and accumulation, cumulative frequency is better suited.
- Type of Data: Consider the nature of the dataset and what insights are most relevant. Some analyses may benefit from both types for a comprehensive understanding.
- Analysis Complexity: Simpler inquiries might lean towards relative frequency for its straightforward approach, whereas more complex analyses might require the depth provided by cumulative frequency.
Visual Representation
Graphs and Charts for Relative Frequency
Visual tools like bar charts and pie charts are commonly used to represent relative frequency data due to their effectiveness in showcasing proportional relationships:
- Bar Charts: Ideal for comparing the relative frequency of different categories side by side, offering clear visual distinctions between values.
- Pie Charts: Provide a holistic view of how each category contributes to the total, emphasizing the part-to-whole relationship.
Graphs and Charts for Cumulative Frequency
Cumulative frequency is often visualized through ogives or cumulative frequency histograms, which illustrate how frequencies accumulate across categories:
- Ogives (Cumulative Frequency Curves): These graphs show the cumulative total of observations up to each point, providing a clear visualization of data distribution over intervals.
- Cumulative Frequency Histograms: Similar to ogives, these histograms stack data to reflect cumulative totals, offering insights into the overall data structure and distribution.
Interpreting Data Visually
Visual representations require careful interpretation to avoid misunderstandings. Here are some tips for interpreting graphs accurately:
- Identify Key Trends: Look for patterns or outliers that may indicate significant insights about the data.
- Understand Scales and Labels: Pay attention to axis labels and scales to grasp the true magnitude of the data represented.
- Compare Relative Positions: In comparative graphs, the position of one category relative to others can highlight notable differences or similarities.
Common Pitfalls
Errors in Calculation
Mistakes in calculating relative or cumulative frequencies can lead to incorrect conclusions. Common errors include miscounting data points, incorrect division, or failing to include all relevant data in cumulative totals.
Misinterpretation of Results
Interpreting data requires not just an understanding of the numbers but also the context. Misinterpretation can occur when:
- Ignoring Context: Not considering the dataset’s context can lead to erroneous assumptions about the significance of the data.
- Overemphasis on Outliers: Giving too much weight to outliers may skew the analysis and lead to inaccurate generalizations.
Avoiding Common Mistakes
To ensure accurate and reliable analysis, consider the following strategies:
- Double-Check Calculations: Always verify your calculations to prevent simple errors from leading to incorrect conclusions.
- Understand Your Data: Familiarize yourself with the dataset’s background and context to interpret the frequencies appropriately.
- Use Software Tools: Employ statistical software or tools for more complex datasets to reduce the risk of human error.
FAQs
What is relative frequency?
Relative frequency is calculated by dividing the frequency of a specific value by the total number of data points. This measure provides insight into how common or rare a value is within a dataset, expressed as a fraction or percentage, facilitating comparisons between different categories or groups.
How do you find cumulative frequency?
To find cumulative frequency, one starts with the first frequency count and adds it to the subsequent frequency counts sequentially. This process creates a running total of frequencies, showing the number of observations that fall below the upper boundary of each category or value range.
Why is cumulative frequency useful?
Cumulative frequency is particularly useful for identifying the distribution and range within a dataset. It helps in understanding the proportion of observations that fall below a certain value, making it essential for percentile calculations, trend analysis, and data summarization.
Can relative and cumulative frequencies be represented visually?
Yes, both relative and cumulative frequencies can be represented visually through graphs and charts. Relative frequencies are often depicted using pie charts or bar graphs to compare different categories. Cumulative frequencies are typically illustrated with ogives or cumulative frequency histograms, showcasing the accumulation of data points across categories.
Conclusion
The journey through the realms of relative frequency and cumulative frequency illuminates the varied ways in which data can be dissected, analyzed, and understood. These concepts not only serve as tools for statistical analysis but also as lenses through which the intricate stories data tells can be interpreted and appreciated.
Recognizing the differences and applications of relative and cumulative frequencies equips analysts, researchers, and data enthusiasts with the ability to make informed decisions, draw meaningful conclusions, and uncover the narratives hidden within numbers. As we continue to navigate through vast seas of data, these statistical measures will remain pivotal in transforming raw data into actionable insights and knowledge.
