Statistical frequencies serve as foundational pillars in the vast and intricate world of data analysis, providing insights into how often certain values occur within a dataset. These measures are crucial for understanding patterns, making predictions, and decision-making across various fields, from business to science. As we delve into the specifics of relative and cumulative frequency, we encounter tools that, though similar in purpose, differ significantly in application and interpretation.
Relative frequency refers to the proportion of times a specific value occurs compared to the overall number of data points. Cumulative frequency, on the other hand, is the sum of frequencies for a given value and all values that precede it in a dataset. These concepts help in understanding not just the distribution of individual data points but also the cumulative trends that emerge within the data set.
While both relative and cumulative frequencies play pivotal roles in statistical analysis, their applications, calculation methods, and implications for data interpretation vary greatly. Relative frequency offers a percentage-based perspective, making it easier to compare different datasets or categories within a dataset. Cumulative frequency provides a running total that reveals the data’s accumulating tendency, useful in identifying distribution patterns and setting thresholds.

Basics of Frequency
Definition of Frequency
Frequency refers to the number of times an event or a value occurs in a given dataset. It’s a simple concept at the heart of data analysis and statistics, serving as the foundation for more complex analyses.
Types of Frequency
There are mainly three types of frequency in statistics:
- Absolute frequency: The pure count of occurrences.
- Relative frequency: A ratio that compares the count of occurrences to the total number of events or values.
- Cumulative frequency: A running total of frequencies up to a certain point in a dataset.
Each type plays a crucial role in understanding data distributions and patterns.
Role in Statistics
Frequency analysis helps in summarizing data, identifying trends, and making comparisons. It is fundamental for creating histograms, frequency tables, and for the preliminary analysis before diving into more advanced statistical methods.
What Is Relative Frequency?
Definition and Explanation
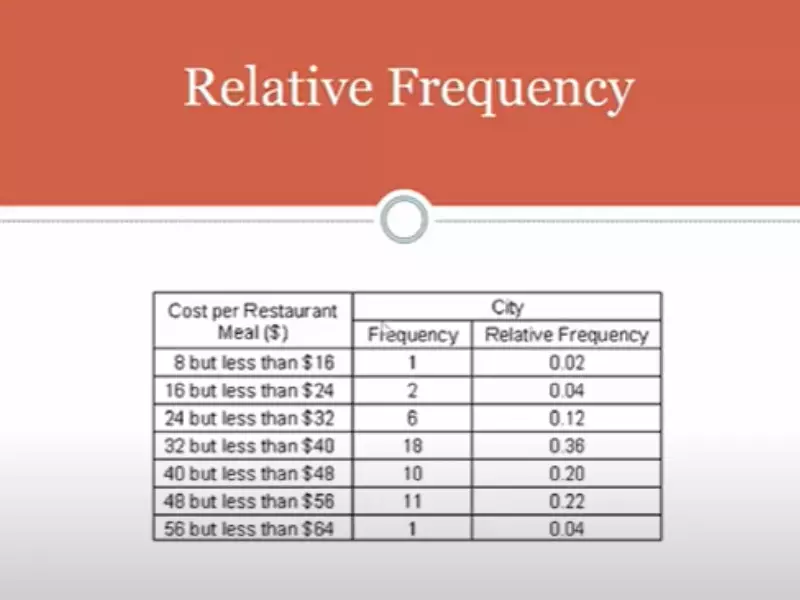
Relative frequency measures how often a particular event or value occurs in relation to the total number of events or values. It’s represented as a fraction or percentage and provides insight into the proportionality of occurrences within a dataset.
Calculation Method
To calculate relative frequency, follow these simple steps:
- Count the total number of occurrences of the specific event.
- Divide this count by the total number of events in the dataset.
- Convert the result into a percentage (optional).
This method highlights the importance of each category relative to the whole.
Examples and Applications
Relative frequency is widely used in market research to understand consumer behavior, in medicine to track disease rates, and in education to analyze test scores. For instance, if out of 100 quiz attempts, a student gets 80 answers right, the relative frequency of correct answers is 80/100 or 80%.
What Is Cumulative Frequency?
Definition and Explanation
Cumulative frequency is the total count of all frequencies up to a certain point in a dataset. It accumulates data as it progresses, providing a running total that reflects the accumulation of frequencies.
Calculation Method
To determine cumulative frequency:
- List the events or values in ascending order.
- Add the frequency of the first data point to the frequency of the second, and continue this process down the list.
- The final number will represent the cumulative frequency of the entire dataset.
Examples and Applications
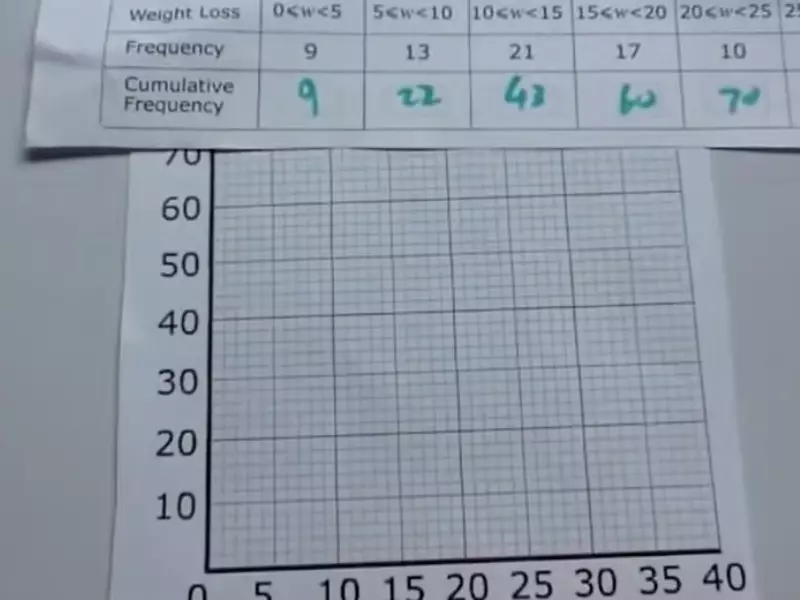
Cumulative frequency is key in creating cumulative frequency distributions or ogives, useful in determining medians, quartiles, and in assessing the data distribution’s skewness. For example, in tracking daily sales, if Monday’s sales are 40 units and Tuesday’s are 50, the cumulative frequency for Tuesday is 90 units.
Key Differences
Comparison Table
| Feature | Relative Frequency | Cumulative Frequency |
|---|---|---|
| Definition | Proportion of total occurrences | Running total of occurrences |
| Representation | Percentage or fraction | Total count |
| Focus | Proportionality | Accumulation |
| Calculation Basis | Individual vs. total | Addition over sequence |
Distinct Characteristics
Relative frequency focuses on the proportion of each occurrence, offering insight into how significant or frequent an event is in the context of the whole dataset. Cumulative frequency, on the other hand, emphasizes the accumulation of data points, providing a sense of the data’s cumulative effect over a sequence.
Practical Implications
The choice between relative and cumulative frequency depends on the analytical goal. If the aim is to understand the distribution or proportionality of data, relative frequency is more appropriate. For assessing trends over time or determining thresholds within data, cumulative frequency is more suitable.

Calculation Insights
Step-by-step Guide for Both
Relative Frequency Calculation:
- Identify the total number of observations in your dataset.
- Count the occurrences of the specific event.
- Divide the event count by the total number of observations.
- Express the result as a fraction, decimal, or percentage.
Cumulative Frequency Calculation:
- Arrange data points in ascending order.
- Start with the first value as the initial cumulative frequency.
- Add the frequency of the next data point to the current cumulative total.
- Continue this process for all data points.
Tools and Software
- Excel or Google Sheets for basic frequency analysis.
- Statistical software like SPSS or R for more complex datasets.
- Online calculators for quick calculations.
Tips for Accurate Calculations
- Double-check data for errors before starting.
- Use automated tools for large datasets to avoid manual calculation mistakes.
- Review the calculation method if results seem off.
Applications in Real Life
Relative Frequency Usage
- In marketing, to determine the percentage of customers preferring a specific product over others.
- Healthcare professionals use it to track the proportion of patients with a certain disease.
- Educators analyze test results to identify the most commonly correct or incorrect answers.
Cumulative Frequency Usage
- Economists use it to analyze income distribution across populations.
- In meteorology, to track the cumulative rainfall or temperature changes over a period.
- Project managers apply it to assess the completion of tasks over the duration of a project.
Comparative Analysis
While relative frequency helps in understanding proportions within a dataset, cumulative frequency provides insights into the data’s accumulation and trends over time. The application depends largely on the objective of the analysis, whether it is to understand distribution or to observe trends and patterns.
Choosing the Right Method
Factors to Consider
- Objective of analysis: What you aim to understand from the data.
- Type and size of data: Quantitative vs. qualitative, large vs. small datasets.
- Expected outcomes: Proportions, distributions, or trend analysis.
Choosing between relative and cumulative frequency methods depends on these factors, guiding analysts to select the method that best suits their analytical needs.
Common Mistakes
Misinterpretations
- Confusing relative frequency with probability: Though similar, they are not the same.
- Overlooking the importance of sample size in cumulative frequency analysis.
Calculation Errors
- Forgetting to update the cumulative total for each new data point.
- Miscalculating the total number of observations when computing relative frequency.
Avoidance Strategies
- Cross-verify calculations with different methods or tools.
- Educate yourself and your team on the nuances of each frequency type.
- Practice with sample datasets to gain confidence in your calculation skills.
Frequently Asked Questions
What is relative frequency?
Relative frequency is a statistical measure that represents the proportion of times a specific value or category occurs in a dataset relative to the total number of observations. It is calculated by dividing the frequency of the specific value by the total number of data points, often expressed as a percentage, providing insight into the significance of particular data points within the larger dataset.
How is cumulative frequency different from relative frequency?
Cumulative frequency differs from relative frequency in its approach to data aggregation. While relative frequency focuses on the proportion of individual categories or values, cumulative frequency sums up the frequencies of a category and all categories that precede it. This accumulation process highlights the distribution curve and allows for the analysis of data points within a continuum, showing how totals build up across a dataset.
Why are relative and cumulative frequencies important?
Relative and cumulative frequencies are important because they provide different perspectives on data distribution and patterns. Relative frequency helps in understanding the proportionate importance of specific data points, making it easier to compare different groups or categories. Cumulative frequency offers insights into the accumulation and distribution trends, useful for identifying medians, quartiles, and other statistical measures. Together, they enable a comprehensive analysis of datasets.
How do you calculate relative frequency?
To calculate relative frequency, you divide the frequency of the target category or value by the total number of data points in the dataset. The result is then often expressed as a percentage. This calculation provides a clear understanding of how significant a particular data point is within the context of the entire dataset, enabling comparisons and analysis of prevalence or rarity.
Conclusion
In the intricate dance of numbers that is data analysis, understanding the different tools and methods at our disposal is key to drawing accurate and meaningful insights. Relative and cumulative frequencies, each with their unique perspectives on data, empower analysts to uncover patterns, compare datasets, and make informed decisions. By comprehensively understanding these concepts, one can appreciate the depth and breadth of statistical analysis.
These statistical measures, though seemingly straightforward, open the door to a world of interpretation and application that extends far beyond mere calculation. As we continue to navigate through data in our quest for knowledge, the judicious application of relative and cumulative frequencies will remain a beacon, guiding our analysis and helping us to illuminate the unseen patterns woven within our data.
